Trading Accounts
Trading Conditions
Financials
CFD Trading instruments

Don’t waste your time – keep track of how NFP affects the US dollar!
The ASIC policy prohibits us from providing services to clients in your region. Are you already registered with FBS and want to continue working in your Personal area?
Personal areaInformation is not investment advice
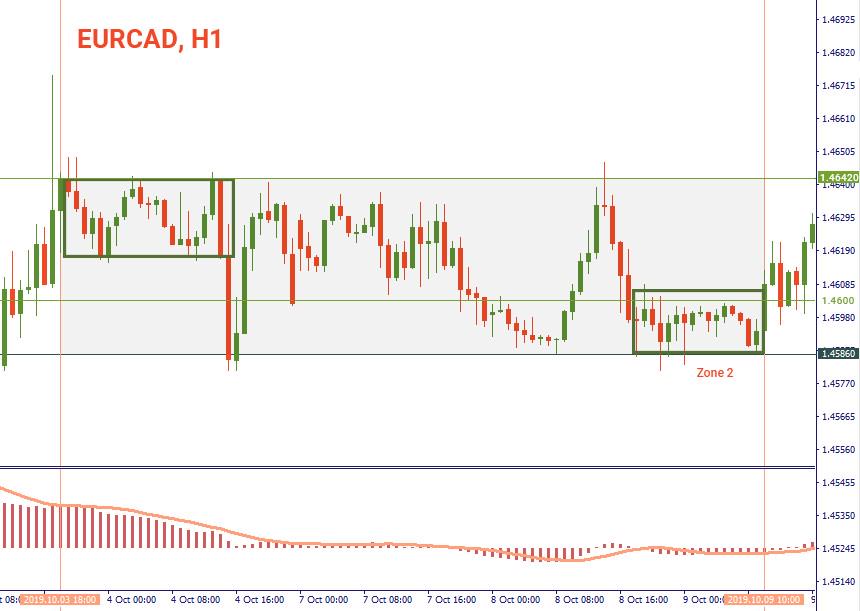
In the previous part of our tutorial, we’ve looked through the most popular trend technical indicators. The thing is that most of the time, prices are meandering without a certain direction (they are ranging). While this directionless price movement drives some traders crazy, others manage to make a living on these roundabouts. Traders have a Plenty’s Horn of technical tools for trading ranging market. These tools are called oscillators. We will fill you in on the most popular ones.
Oscillators help us identify pivotal points of the market – potential reversal areas. These indicators are banded between 2 extreme values indicating overbought and oversold areas. When the oscillator is in the overbought area, it means that the force of the bullish move has weakened and a reversal to the downside is likely. Accordingly, when the oscillator is in the oversold area, it means that the sellers have become weaker and the trend is likely to reserve up.
Trading with oscillators is based on the recurrence principle: after hitting an extreme value, the oscillator always returns to its central reading. However, there’s a big difference between the dynamics of the price and the oscillator: although they move in tandem with each other, these moves have different proportions. As a result, when the indicator returns to its normal value, the prices usually don’t return to the same point.
Oscillators are most effective when the prices move sideways. As the purpose of all oscillators is the same, there’s little point in adding several oscillators to one chart. Use oscillators in combination with other technical tools.
