
Trading Accounts
Trading Conditions
Financials
CFD Trading instruments

Don’t waste your time – keep track of how NFP affects the US dollar!
The ASIC policy prohibits us from providing services to clients in your region. Are you already registered with FBS and want to continue working in your Personal area?
Personal areaInformation is not investment advice
We all had this problem when it was hard to define the target levels for the price. Usually, the choice of support and resistance levels has a lot of subjectivity involved. That is why many traders use indicators to determine more universal target levels. One of the simplest ways to do that is to use Pivot points.
Pivot points are significant support and resistance levels, which can define potential trades. They were calculated by professional floor traders (exchange members who execute transactions from the floor of the exchange, exclusively for their own account) to set the key levels. These traders used to adapt rapidly to the short-term changes in the market.
At the beginning of the trading session, they looked at the previous day’s high, low and the closing price to calculate a pivot point for the current trading day. Afterward, support 1, support 2, resistance 1 and resistance 2 were calculated. The levels were used for the daily trading. This is known as a traditional 5-point system.
Let’s start with the classics.
The main pivot point (PP) is the central pivot. The central pivot is the main support/resistance. This means the price is expected to float around this level most of the time. It is used as the base for all other pivot levels.
The pivot point is calculated as follows:
Pivot Point (PP) = (High + Low + Close)/3
The rule behind this calculation is simple: we take yesterday’s high, low and close price and divide it by 3.
Support 1 (S1) = (PP x 2) – Previous High;
Support 2 (S2) = PP – (Previous High – Previous Low);
Resistance 1 (R1) = (PP x 2) – Previous Low;
Resistance 2 (R2) = PP + (Previous High – Previous Low).
Sometimes the opening price is also used in the formula. In that case, the equation is:
PP = ((Today’s Open) + Yesterday's (High + Low + Close)) / 4
The levels of support and resistance are calculated the same as in the 5-point system.
The classic 5-point system is not the only way of calculating Pivot points.
Let’s look at the other types.
Some traders use Pivots based on Woodie formulas. They are calculated very differently:
R2 = PP + High – Low
R1 = (2 X PP) – Low
PP = (High + Low + 2Close) / 4
S1 = (2 X PP) – High
S2 = PP – High + Low
Some traders prefer them as they give more weight to the closing price of the previous period.
These levels are similar to the Woodie, although they are calculated for 8 major levels (4 resistance and 4 support).
R4 = C + ((H-L) x 1.5000)
R3 = C + ((H-L) x 1.2500)
R2 = C + ((H-L) x 1.1666)
R1 = C + ((H-L) x 1.0833)
PP = (H + L + C) / 3
S1 = C – ((H-L) x 1.0833)
S2 = C – ((H-L) x 1.1666)
S3 = C – ((H-L) x 1.2500)
S4 = C – ((H-L) x 1.5000)
The main point of this type is the usage of Fibonacci levels in calculating the supports and resistances.
R3 = PP + ((High – Low) x 1.000)
R2 = PP + ((High – Low) x 0.618)
R1 = PP + ((High – Low) x 0.382)
PP = (H + L + C) / 3
S1 = PP – ((High – Low) x 0.382)
S2 = PP – ((High – Low) x 0.618)
S3 = PP – ((High – Low) x 1.000)
Pivot points levels change depending on the period you choose. There are daily, weekly, monthly and yearly pivot points.
Usually, we use daily pivots for trading on the M30 and shorter intraday timeframes. They use the previous day’s high, low and close. The figures update every day.
We use the weekly pivot points on H1, H4, D1 charts. To calculate these levels, the previous week’s high, low and close are used. Take a note that they do not change until the next week starts.
On the weekly charts, we recommend you to use monthly pivots. They gather the data from the previous month.
In case you analyze the monthly chart, it is possible to apply the yearly pivots. It uses the high, low and close of the previous year.
There are a lot of strategies of using pivot points by traders. Let’s look at the most frequently used.
Pivot points can be used as traditional support and resistance levels. Range-bound forex traders place a buy order near identified levels of support and a sell order when the pair near the resistance. The more times a currency pair touches a pivot level then reverses, the stronger the level is.
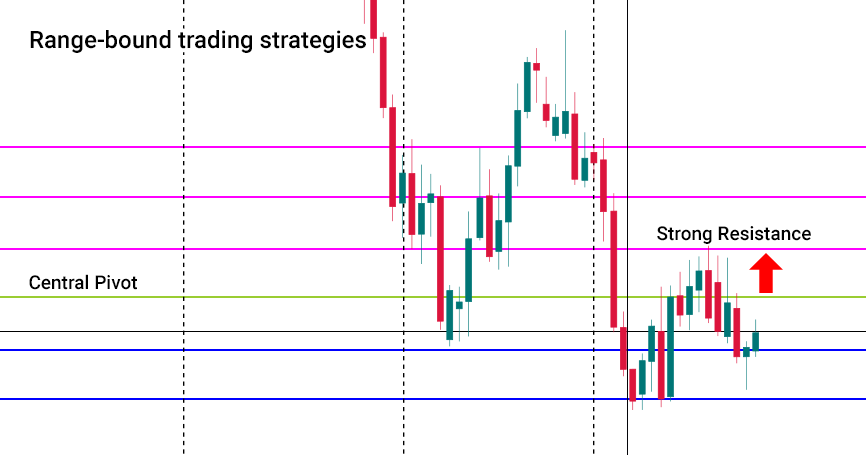
Keep in mind, that support levels become resistances if the price is below them and resistances become supports if the price is above them.
Breakout forex traders use pivot points to identify the key levels that need to be broken to determine a further direction of the price.
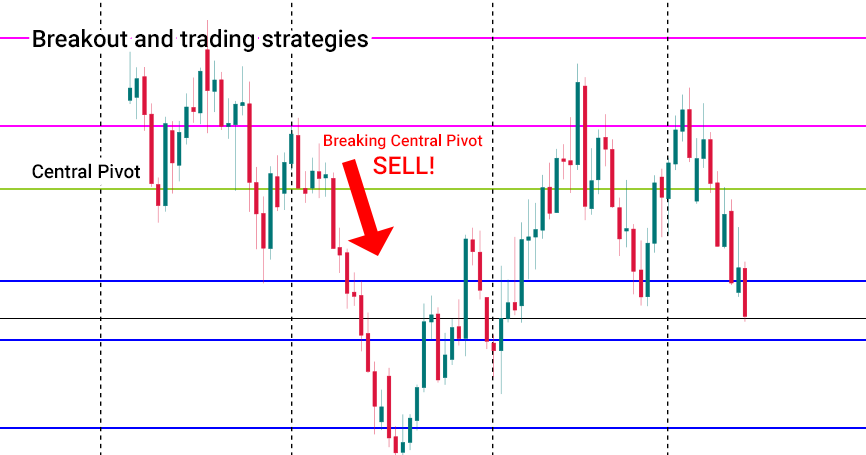
Be careful with this strategy as it is hard to define whether it’s a breakout or fakeout. Spikes are a common occurrence during news events, so be sure to keep up with breaking news and be aware of what’s in the economic calendar for the day or week.
Pivots may be used to identify the overall market trend.
Another important thing to know is connected with the market opening hours.
As we know, the Forex market is functioning 24 hours a day. There are four market sessions: Australian, Japanese, UK and USA. You can find the approximate time for each of them Time of trading sessions.
When one of the markets opens, there is a high possibility of breaking the pivot levels as a lot of traders enter the market at the same time. During the period when the US market is closed and the Asian market opens, prices may remain stable for hours between the pivot point and either support or resistance. This gives opportunities to range-bound traders.
To conclude, the pivot points are helpful for trader in different ways. You can use them on their own or in combination with other indicators. The second option allows you to create and practice your own unique trading strategy.

