Trading Accounts
Trading Conditions
Financials
CFD Trading instruments

Don’t waste your time – keep track of how NFP affects the US dollar!
The ASIC policy prohibits us from providing services to clients in your region. Are you already registered with FBS and want to continue working in your Personal area?
Personal areaInformation is not investment advice
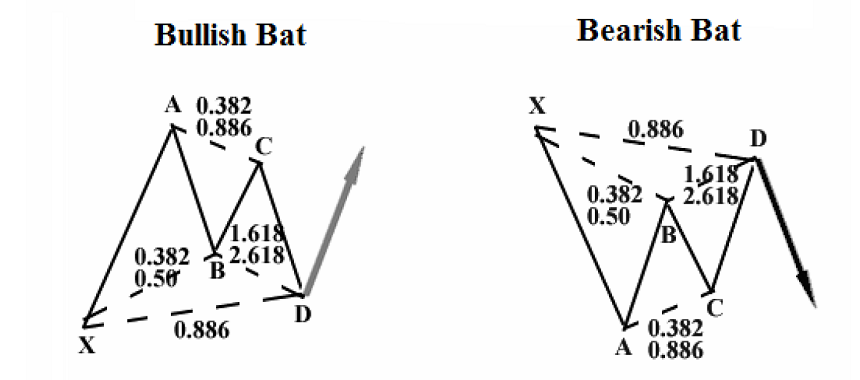
The Bat pattern is a variation of the harmonic pattern Gartley pattern. The outlines of these patterns are the same, the difference is in Fibonacci ratios that define the positions of the main points.

Let’s have a look at the parameters of a Bat pattern:
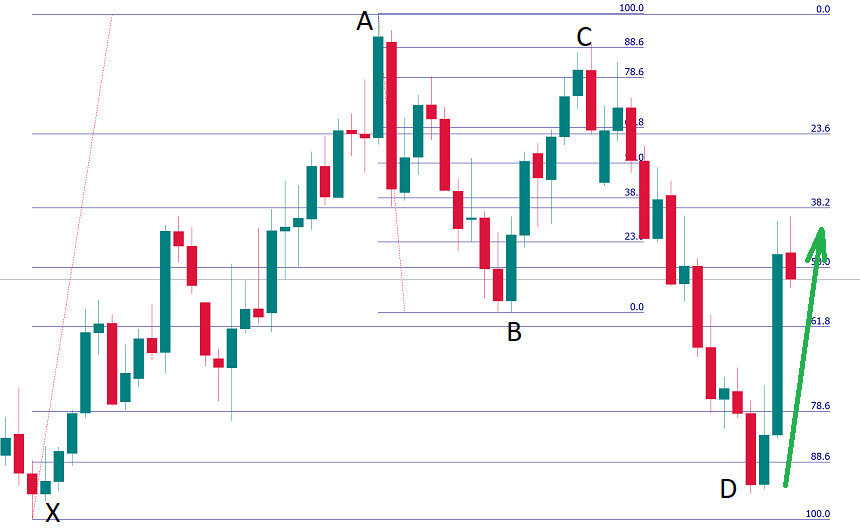
Let's have a look at the example of the bullish Bat pattern on the chart.

You can see that the point B is at about the 61.8% retracement of XA, the point C is at the 88.6% retracement of AB, while the point D is near the 88.6% retracement of XA. The Fibo ratios are not exactly the same as at the scheme, but they are close enough. Notice that a "harami" candlestick pattern was formed at the point D confirming the price's reversal to the upside.