Trading Accounts
Trading Conditions
Financials
CFD Trading instruments

Don’t waste your time – keep track of how NFP affects the US dollar!
The ASIC policy prohibits us from providing services to clients in your region. Are you already registered with FBS and want to continue working in your Personal area?
Personal areaInformation is not investment advice
In the first article about the Elliott Wave Principle, we found out that there are waves on the markets. Let’s go on! This time we’ll focus on one of the main pillars of the EWP: motive and corrective waves.
Simply put, a motive wave is a price movement in the direction of the main trend. In other words, each motive wave is a step forward during a rally. Motive waves always subdivide into five smaller waves according to certain rules.
As the name implies, a corrective wave comes after a motive wave. So, during a trend, motive and corrective waves form one after the other. While a motive wave is a move forwards, a corrective wave is a step back within a trend.
All Elliott wave patterns are classified into motive and corrective waves.
The motive waves are:
The corrective waves are:
There are rules and guidelines for each of these patterns that we’ll examine in next articles.
Let’s have a look at the real wave count below. There’s an amazing bullish rally in USDTRY and we can identify the motive and the corrective waves. As we can see, there are three motive waves (in red) and two corrective waves (in blue) that form a pattern called ‘impulse’. However, there’s another thing we should mention.
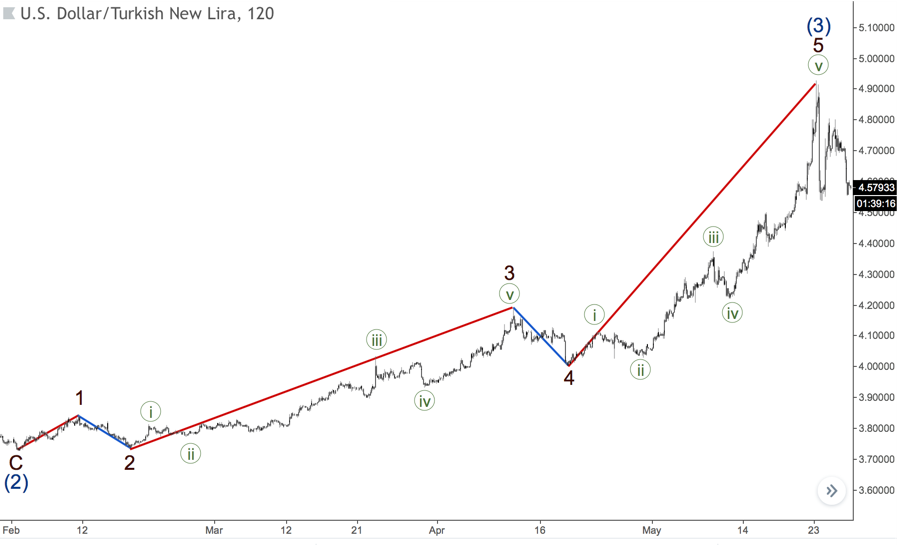
Can you see the smaller waves inside each motive or corrective wave in the chart above? As we know from the last article, Elliott waves are like a Russian nesting doll (Matryoshka). That means that each wave is built of smaller waves and, at the same time, each wave is a part of a bigger wave.
So, on every single chart, you can have a motive and corrective waves that differ by size. If you want to do a wave count, you should identify these waves by certain rules and guidelines.
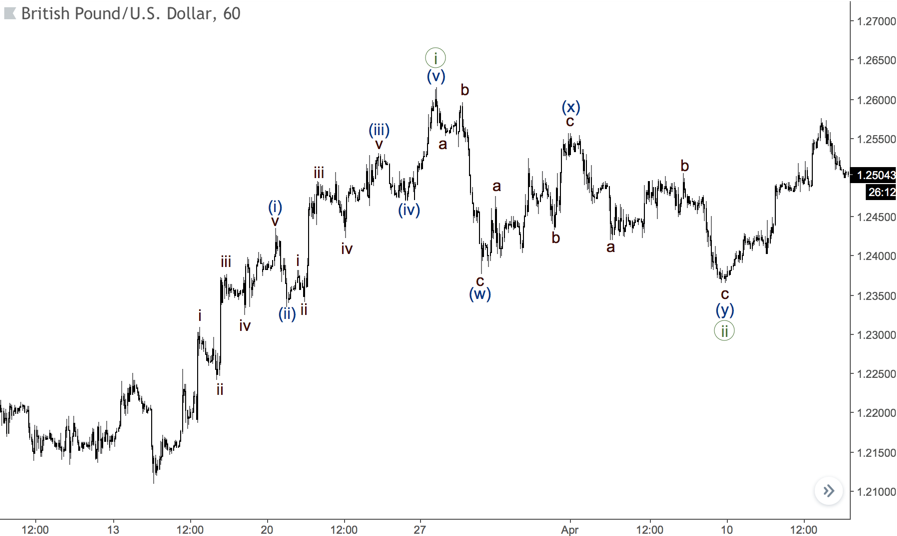
For a better understanding of wave degrees, let’s have a look at the chart below. There’s an upward wave, which we labelled as ((i)). After this wave, we have a downward correction, wave ((ii)). So, we found two waves.
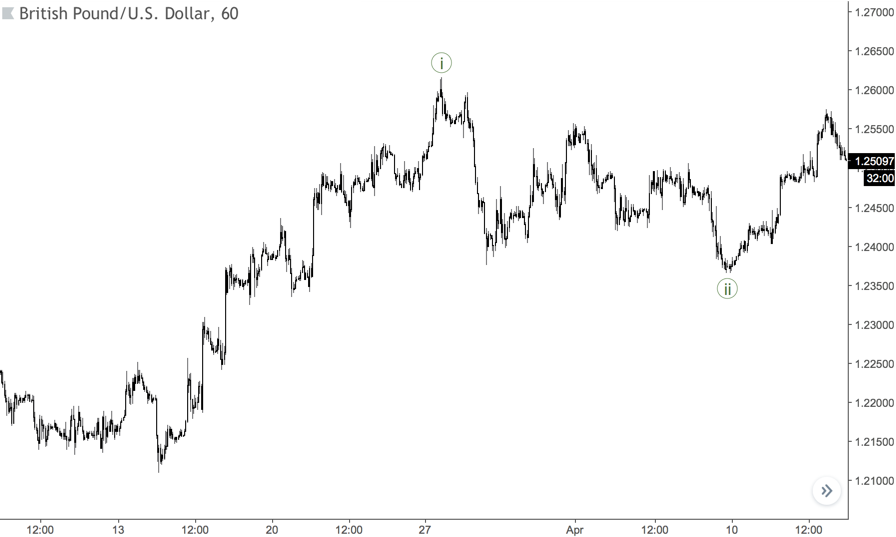
However, inside wave ((i)) we can see some smaller waves, which are one degree lower. At the same time, there are also smaller waves inside the wave ((ii)). So, now we labelled waves of two degrees, let’s go further.
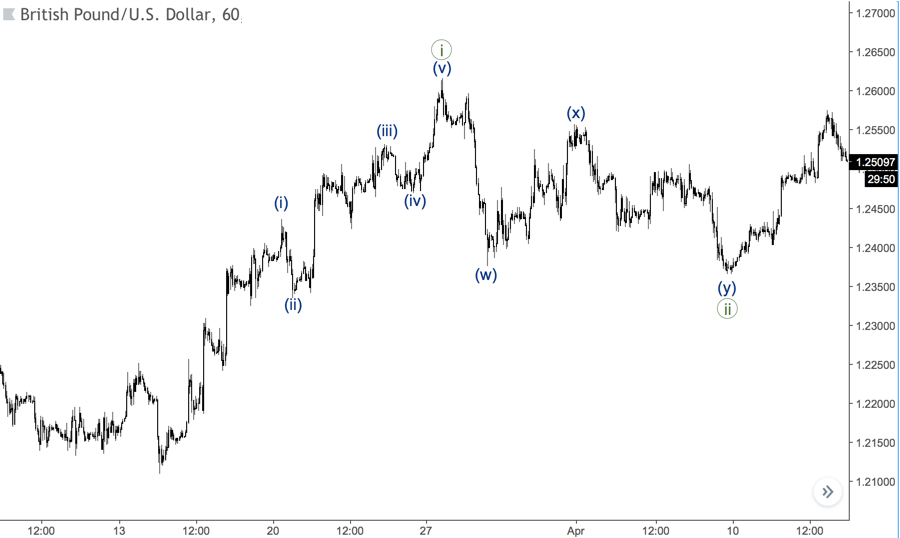
As you can see in the next chart, there are even smaller waves. This means that we can subdivide each wave into smaller waves until we reach the lowest timeframe possible. Sometimes, you can see beautiful waves like ones they show in books, but you can also find quite ugly waves as well, especially on the intraday timeframes.
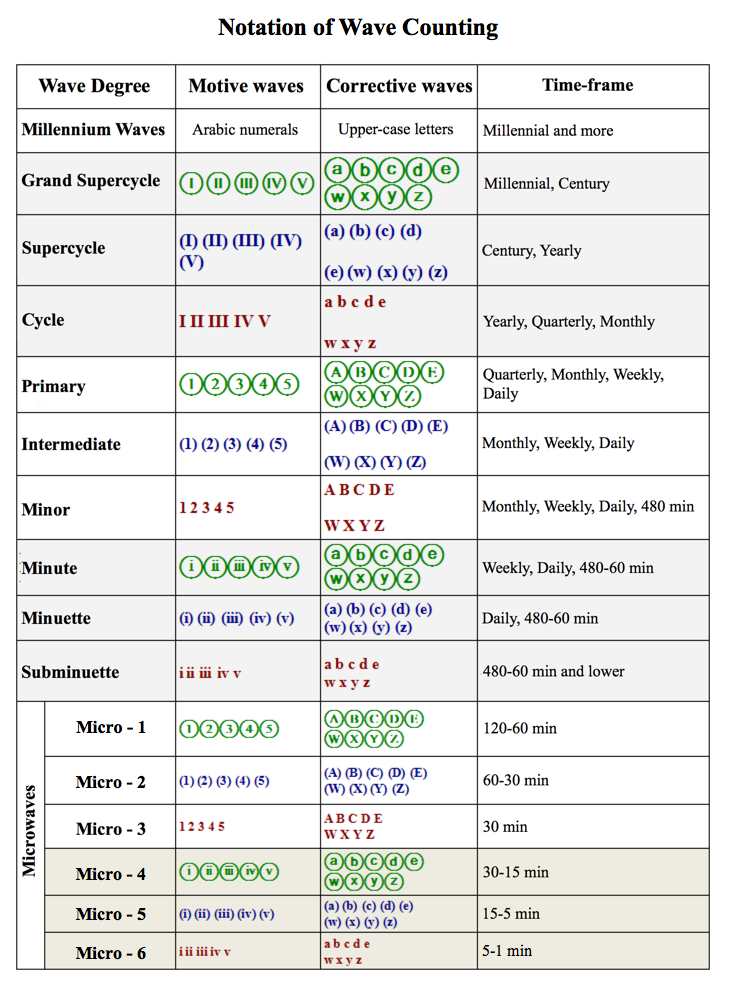
Have you noticed that there’re different styles of labelling for each wave degree on the charts above? This is called notation of wave counting. We use it to specify wave degrees on the chart and also to improve the communication between analysts. Without using wave notation it can be quite difficult to explain wave count to someone.
As you can see from the table below, there is a sequence of numbers (for motive waves) and letters (for corrections).
For Motive waves, we use sets of three Roman and Arabic numerals, which alternate one after the other. Corrections are labelled with alternating sets of three upper-case and lower-case letters. We use Roman numerals and lower-case letters, or Arabic numerals and upper-case letters under the same wave degree.
Everywhere. You can do a wave count on every single market. However, it’s better to choose markets with good liquidity because of the EWP nature. If we try to count on an unpopular market with many gaps and ugly bars, well... we’re likely to experience some issues.
Also, it’s better for beginners to count trend markets rather than consolidating once. Why? Just because if we have such a long consolidation, which has been developing for many years, we’re likely going to count a pretty difficult correction structure. If so, there’s a good chance to be wrong because the more complicated your wave count gets, the greater the risk.