
Trading Accounts
Trading Conditions
Financials
CFD Trading instruments

Don’t waste your time – keep track of how NFP affects the US dollar!
The ASIC policy prohibits us from providing services to clients in your region. Are you already registered with FBS and want to continue working in your Personal area?
Personal areaInformation is not investment advice
Standard deviation is an indicator that measures deviations of the price from the moving average. In other words, it’s the gauge of volatility.
The SD is included in the default indicator set of MetaTrader. Go to “Insert”, find “Indicators” and then “Trend” – and you will see the Standard Deviation.
The default period is 20, and it is applied as default to ‘Close’ (closing price of each bar). If you increase the period, the indicator’s line will be much smoother and produce extremely high or low readings far less often. If you decrease the period, the SD line will reach extreme highs and lows more frequently. This way, you will get more trade signals. At the same time, more of these signals will be false. As a result, you may need to experiment and adjust the indicator’s settings so that they would suit specific trade instrument and volatility. In general, the standard setting of 20 is considered most reliable.
The SD shows the scale of price changes relating to the Moving Average. If the indicator value increases, the market is volatile and the price swings are rather dispersed relative to the moving average.
If the indicator value is small, it means that the market volatility is low and the price stays close to the moving average.
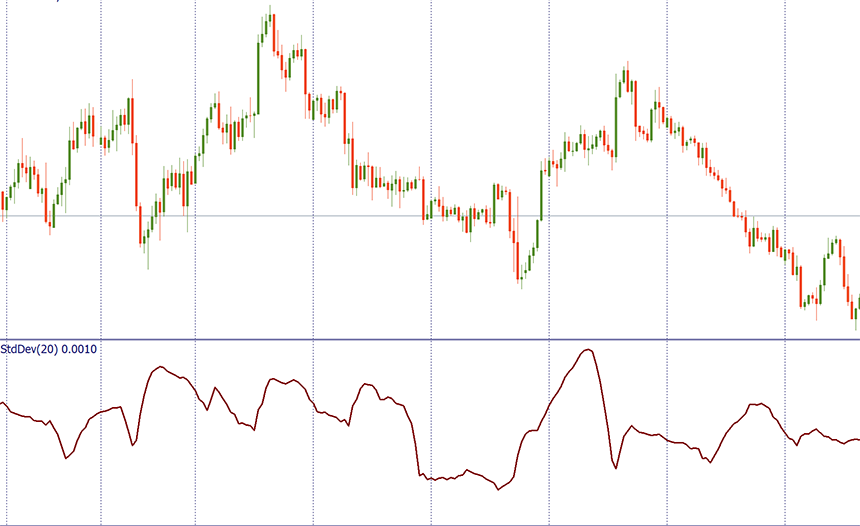
Traders need to know that periods of market activity and calm usually alternate each other, and the price tends to return to the average level every time:
In addition, the current value of the Standard Deviation can be used to estimate the significance of a price movement. A move greater than one standard deviation would show above average strength or weakness of the market, depending on the direction of the move.
The SD is often used as a part of other more sophisticated indicators, for example, the Bollinger Bands. These bands are set 2 standard deviations above and below a moving average. Read more about the Bollinger Bands.
All in all, you the SD indicator can help you to do the following things:
The Standard Deviation is extremely easy to understand. It shows whether volatility is high or low. This information will help you enter the market at the right time.

