
Trading Accounts
Trading Conditions
Financials
CFD Trading instruments

Don’t waste your time – keep track of how NFP affects the US dollar!
The ASIC policy prohibits us from providing services to clients in your region. Are you already registered with FBS and want to continue working in your Personal area?
Personal areaInformation is not investment advice
One of the assumptions of technical analysis is that the price moves in trends. Let’s find out more about these trends.
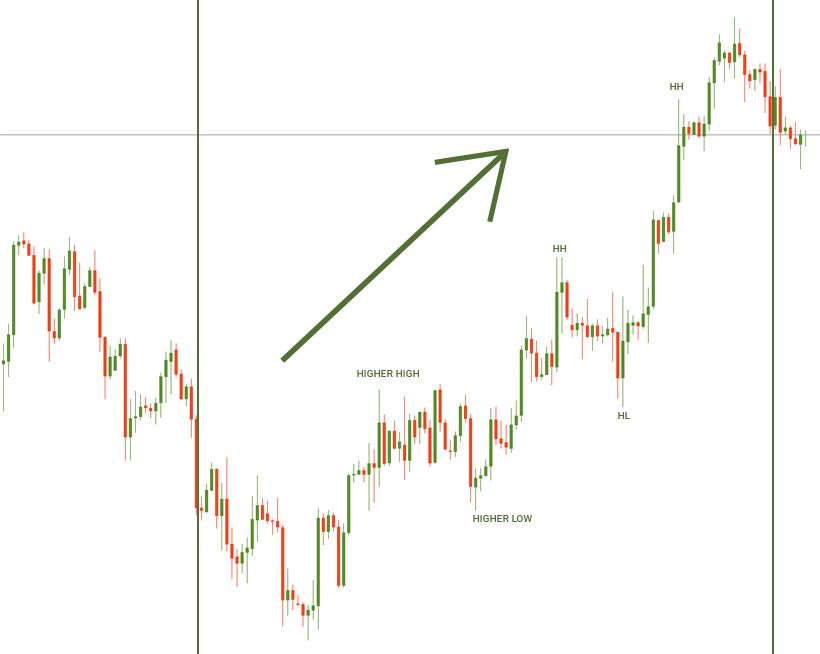
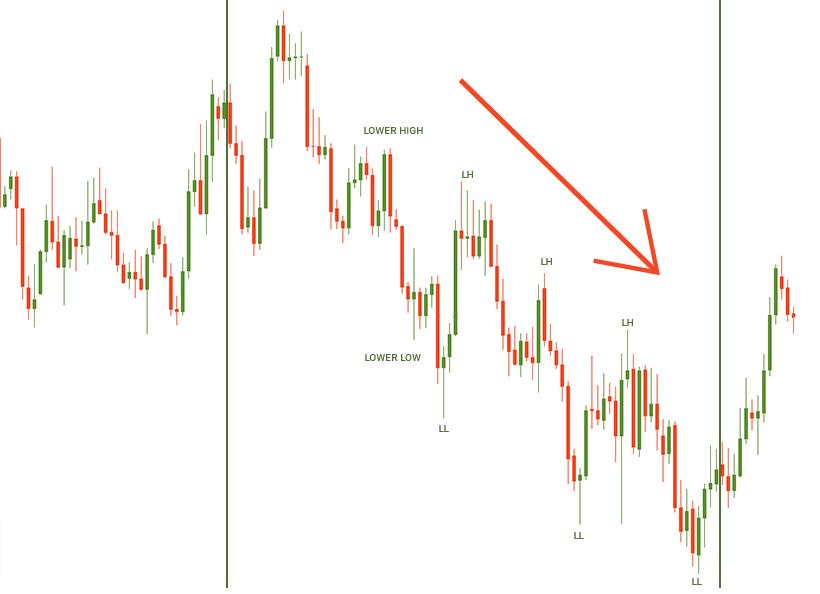
A trend is the general direction of the price of an asset on the market. If you look at a chart of any financial instrument, you will see that prices never move in straight lines, they are constituted of a series of highs and lows. More often than not a price has an upward or downward bias.
There are three types of trends:
In terms of length, trends can be classified as:
Every trend consists of movements in the direction of this trend which are intermitted by counter-trend moves called “retracements” or “corrections”. A trend is expected to continue until a reversal takes place and the direction of a trend changes.
A favorite saying of traders is “A trend is your friend”. The idea behind this phrase is that traders can make good profits by following a trend, i.e. trading in the direction of a trend (buying during an uptrend and selling during a downtrend).
In order to determine which trend is there at the market, traders draw trendlines and use technical indicators.
A trendline is a line drawn through pivot highs or pivot lows of the price chart to show the prevailing direction of price. As such line connects the already formed peaks and troughs of the price, it can be continued (projected) to the right of the current price. It’s assumed that this line will be an obstacle for the price in the future.
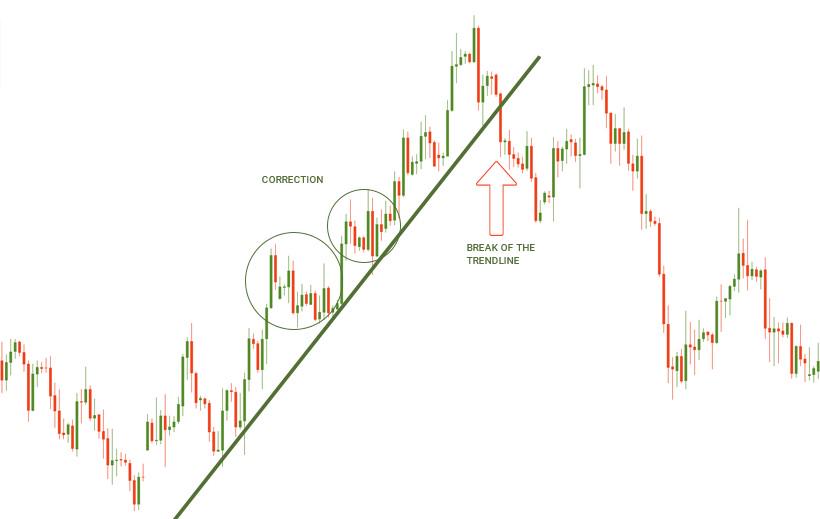
On the picture above you can see the trendline drawn through a price’s low and a higher low in an uptrend. The price respected the trendline for some time continuing moving within a rising trend. Then it broke below the trendline. This was a sign that the uptrend finished and the market reversed down. Those traders who opened buy trades during the uptrend closed their positions and opened sell trades.

