
Trading Accounts
Trading Conditions
Financials
CFD Trading instruments

Don’t waste your time – keep track of how NFP affects the US dollar!
The ASIC policy prohibits us from providing services to clients in your region. Are you already registered with FBS and want to continue working in your Personal area?
Personal areaInformation is not investment advice
Divergence is one of the most efficient trading concepts that offer reliable high-quality trading signals. The most curious thing is that it owes its accuracy to the lagging action of oscillators.
Divergences are a big part of many traders’ strategies. Some use them to identify beneficial entry points, others to choose a proper time for exiting their positions. In this tutorial, we will tell you how to spot and trade these cross-functional trading patterns.
Let’s start with identifying what is a divergence. Basically, divergence means that the price chart and the technical indicator (oscillator) you use for analyzing the market goes in opposite directions. It is the first signal for you to understand that “something” is happening on your chart.
Divergences can be bearish or bullish.
A bearish divergence occurs when the price creates higher highs on the chart, while your indicator makes lower highs. After such bearish divergence prices normally move downwards: the price needs to catch up with the lower indicator.
A bullish divergence (also called “convergence”) occurs when the prices create lower lows on the chart, while your indicator shows higher lows. That is the first indication that prices are going to pick up soon: the price needs to catch up with the higher indicator.
Note that when we talk about bearish divergences we are looking at highs at the price chart. When we talking about bullish divergences, we are talking about lows.
In addition to classic divergences, there are so-called hidden divergences.
A hidden bearish divergence occurs when the price creates lower highs on the chart, while your indicator makes higher highs. The absence of new highs on the price chart shows that bulls are losing strength. Despite the higher high of the oscillator the movement up is likely a retracement. This movement represents an opportunity to sell at higher levels.
A hidden bullish divergence occurs when the price creates higher lows on the chart, while your indicator makes lower lows. The absence of new lows on the price chart shows that bears are losing strength. Despite the lower low of the oscillator the movement down is likely a retracement. This movement represents an opportunity to buy at lower levels.
Experience shows that it’s easier to spot classic divergences than the hidden ones.
|
Type |
Price |
Oscillator |
Description and Trading |
|
Classic: expect reversal |
|||
|
Bearish |
Higher High |
Lower High |
Potential reversal to the downside |
|
Bullish |
Lower Low |
Higher Low |
Potential reversal to the upside |
|
Hidden: expect correction and continuation |
|||
|
Bearish |
Lower High |
Higher High |
Downtrend will likely resume |
|
Bullish |
Higher Low |
Lower Low |
Uptrend will likely resume |
Divergences are normally used for forecasting price corrections and reversals. They are likely to occur before the actual price action. That is something that makes them so effective and allows traders to enter a trade right at the very beginning of the new emerging price move.
For trading divergences, you need to insert one of the oscillators to your chart: Stochastic, Relative Strength Index (RSI), Moving Average Convergence Divergence (MACD).
Regardless of the indicator you choose, we recommend you to always place Stop Loss orders before making your trading bets. It is no different when you trade divergences. You may put a Stop Loss above the last top on the chart which confirms the occurrence of bearish divergence. If the divergence you are dealing with is bullish, you should place a Stop Loss below the last bottom on the chart.
To find a place for a Take Profit order you will probably need an additional indicator (especially if you trade with RSI and Stochastic). You may use swing analysis or support/resistance levels for setting Take Profit. However, if you prefer using MACD while trading divergences, then you could fully rely on this indicator alone without any supplementary trading tools. When MACD histogram crosses the signal line upside down, it’s a signal to close bullish position. When MACD histogram crosses the signal line bottom up, it’s a signal to close bearish position.
Here is an example of divergence trade with MACD oscillator.
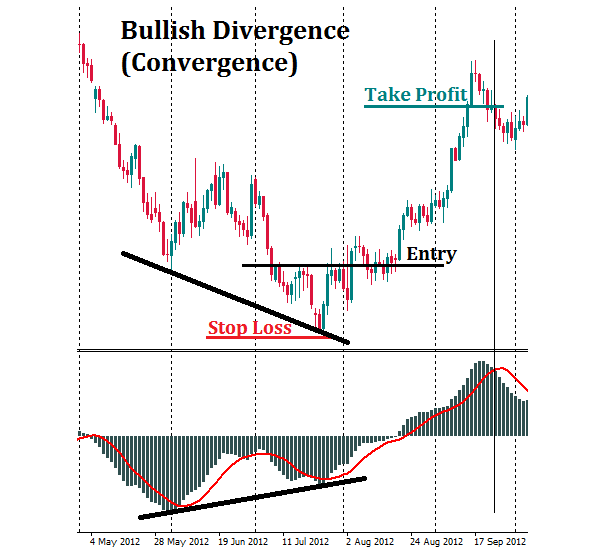
Suppose you found a bullish divergence (convergence) between the MACD and the price chart. In addition, you notice a bullish crossover in the MACD window. You use this price divergence as a signal to open a long position. A Stop Loss order should be placed below the last bottom of the price. Close your trade when the bearish crossover on the MACD oscillator is formed.

