
Trading Accounts
Trading Conditions
Financials
CFD Trading instruments

Don’t waste your time – keep track of how NFP affects the US dollar!
The ASIC policy prohibits us from providing services to clients in your region. Are you already registered with FBS and want to continue working in your Personal area?
Personal areaInformation is not investment advice
There are a lot of technical tools that help to determine important levels. Traders draw these levels through previous highs and lows, use Fibonacci retracements and pivot points, trend lines etc. Important levels act as support/resistance for the price. The more times the price touches such level, the more valid level you managed to find.
When the price breaks an important level, it means that it should continue moving in that direction. However, that will happen only in case of a real breakout and this doesn’t happen every time. In many cases, a price goes above an important level but doesn’t manage to sustain this movement. It gets back to its previous trading range, so the breakout turns out to be false.
Right after the price moves through a level, it can be very difficult to say. At the same time, it’s obvious that a trader should trade a real breakout and a false breakout differently.
Note that such price patterns like channels, triangles and flags can be truly valuable for the identification of potential breaking points. The more important the level is, the harder it will be for a price to break it. At the same time, remember that a real break of such level will have a more far-going consequence.
It is worth to say that there are more false breaks than true ones. Novice traders tend to rush into the breakout trade without a real confirmation of a break but are pushed out of the market by larger players.
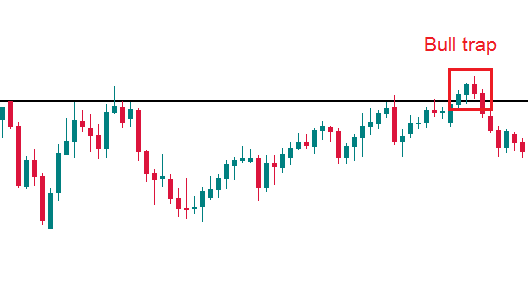
When after a breakout attempt, the price returns to the previous trading range and fixes there, it is a false breakout. It may happen instantly after a price pierces an important level or after up to 4 candles beyond the level. The latter is referred to as bull/bear trap. Reversal candlestick patterns in the vicinity of a “breakout” level give reliable hints that a break has failed.
False breakouts are best traded in the direction of the trend. We highly recommend you analyzing H1 and higher timeframes as at smaller ones (M30, M15, etc.) the price action is too chaotic.
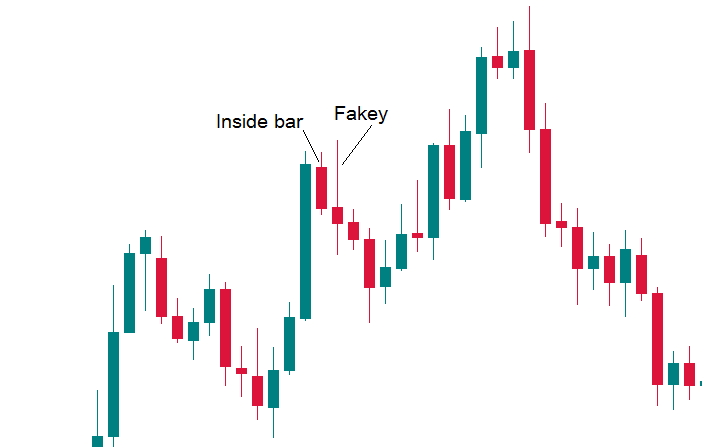
A particular case to mention is the so-called Fakey pattern or, in other words, a false breakout of an inside bar. An inside bar is a candlestick, which is completely covered by the previous candlestick. If you see an inside bar and then its break ends up in a pin bar candle, it’s a strong signal that the price will move in the direction opposite the false break.
If you decided to enter the market in the direction of a breakout, do it cautiously. In many cases simply putting a pending order, for example, a Sell Stop a bit below a support level, may trigger your entry order and then lead to a loss if the price returns higher.
To solve this problem, some players put entry orders for a short position below the breakout candle. Even so, the risk of a false breakout remains high.
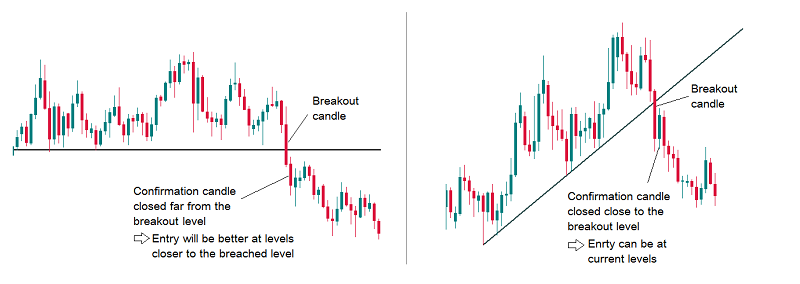
In order to enhance your chance of success, you should look at the breakout candle. Its length should exceed the average at least 1.5 times. It should also have a full body (it can’t be a doji or a pin bar). Even if the candle fits this description and closes below the support level, wait for the second candle – the confirmation candle. It should be smaller than the breakout candle and close below the breakout level as well.
If the confirmation candle closed near the breakout level, we may enter at the market price. If the candle closed far from the breakout level, we put a Sell Limit closer to the breakout level.
Patience is often the best option. In chart patterns like ‘Head and Shoulders’ there’s often a retest of a broken level.
If you decided to trade on a breakout, it means that you are taking a higher risk than otherwise. This higher risk should be reflected in your risk management: it’s recommended to move Stop Loss order to break-even level fast (i.e. move your Stop Loss to a point where your trade will close with 0 loss faster than during range and trend trading). The risk/reward ratio can be up to 1:4, 1:5. You may use scaling out (partially close the position as the price moves in your favor).
Don’t forget about such factors as market’s sentiment, economic news, and common sense. These things can give you hints about the nature of what is happening at the chart.
To sum up, “confirmation” should be your magical word. It doesn’t matter whether we talk about a false or a real break. Real breakout requires more confirmations than the false ones.

