
Trading Accounts
Trading Conditions
Financials
CFD Trading instruments

Don’t waste your time – keep track of how NFP affects the US dollar!
The ASIC policy prohibits us from providing services to clients in your region. Are you already registered with FBS and want to continue working in your Personal area?
Personal areaInformation is not investment advice
Parabolic SAR is a powerful tool that helps to analyze trends. SAR stands for “Stop and Reverse”. It means that the indicator can not only determine a trend but also signal when it’s time to close a trend trade and look in the opposite direction. The indicator was developed by J. Welles Wilder, who is also known for creating such tools as ATR and RSI.
The Parabolic SAR is included in the default set of MetaTrader. You can add it to the chart by clicking “Insert” – “Indicators” – “Oscillators” and then choosing “Parabolic SAR”.
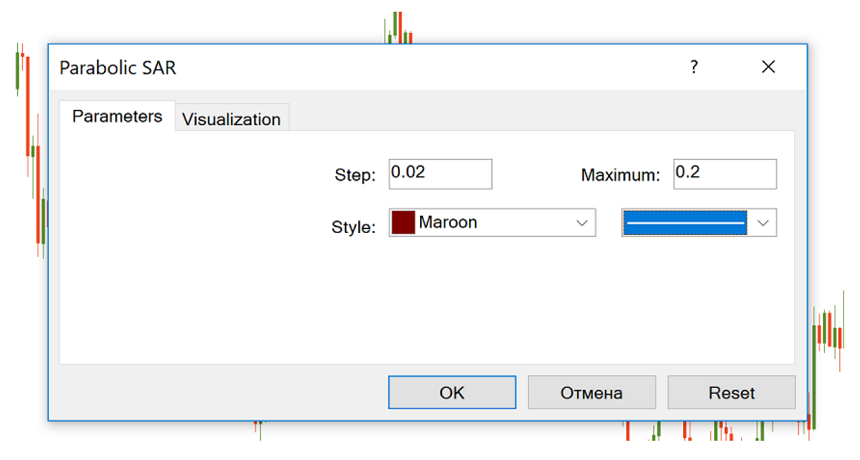
The indicator has 2 parameters you should set: “step“ and “maximum”. Their default values are 0.02 and 0.2. A step is the size of the acceleration factor. The acceleration factor starts with this value and then increases by the step size with each new high (or low for a downtrend), up to the value defined by the maximum parameter.
You can start with the default parameters of the indicator and then adjust them to the asset you trade, timeframes you use and your trading style. Depending on your choice the indicator can be more or less sensitive to the price. The higher the acceleration factor, the closer it will move to the price. However, you shouldn’t set it too high, as in this case there will be too many reversal signals. Wilder recommended not to set the maximum above 0.22.
Parabolic is very simple to use. It is placing dots that define the trend. When the dots are below the price, the trend is bullish, while the dots above the price point at a bearish trend.
When the trend changes direction, parabolic gives an entry signal. It signals bearish reversal when it crosses the price to the upside and forms 3 descending dots above the candlesticks.
Parabolic signals bullish reversal when it crosses the price to the downside and forms 3 ascending dots below the candles.
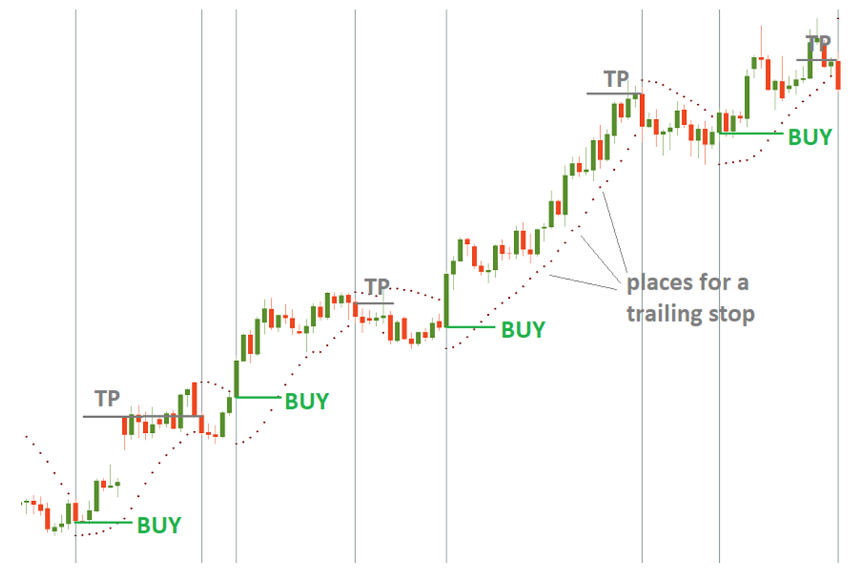
The indicator offers great help in determining exit points. The solution is simple: you close a buy trade when the SAR returns above the price and close a sell trade when Parabolic gets back below the price. This way you hold open positions only in the direction of the indicator’s movement.
Moreover, Parabolic SAR provides a framework for trailing stops. In an uptrend, the indicator will rise following the surging prices. Move your Stop Loss order from one dot to the next in order to limit the risks and lock in profit.
The Parabolic SAR is a powerful and unique indicator. It works best in a trending market with long rallies and declines. In a sideways market, however, there is a high risk of getting false signals.
The SAR will work well in combination with other technical indicators, for example, ADX. If the ADX confirms the presence of a strong trend, you will be then able to use the Parabolic SAR with greater confidence.

