
Trading Accounts
Trading Conditions
Financials
CFD Trading instruments

Don’t waste your time – keep track of how NFP affects the US dollar!
The ASIC policy prohibits us from providing services to clients in your region. Are you already registered with FBS and want to continue working in your Personal area?
Personal areaInformation is not investment advice
There’re rules and guidelines in the Elliott Wave Theory. You must follow all the rules we went through in the previous articles, but the guidelines are not written in stone. In other words, guidelines do not always show, but they are in a sufficient number of cases, so we shouldn’t ignore them.
Simply put, an alternation is about expecting some difference of similar waves’ expression inside a pattern by depth, complexity, and duration. Alternation happens inside impulses and corrections. Let’s see some examples.
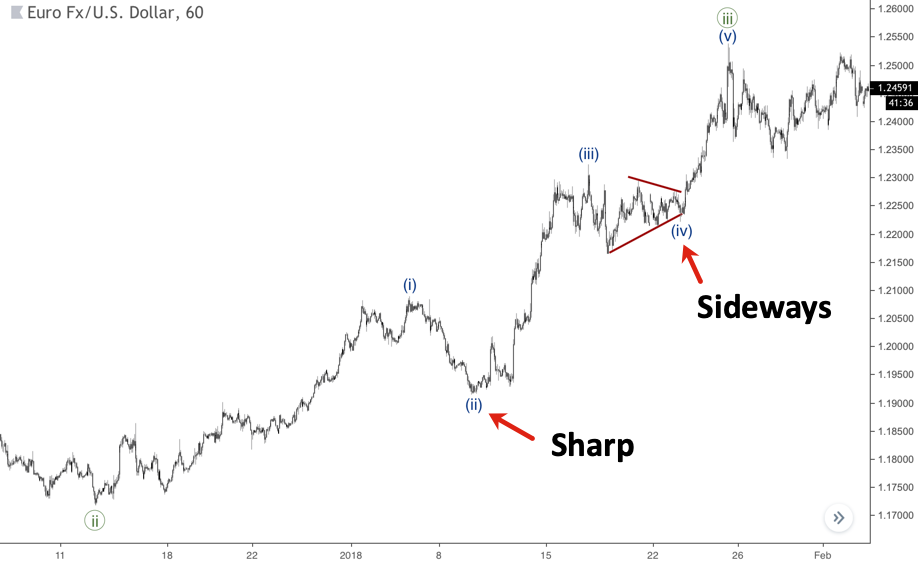
Usually, there’s a relation between waves two and four in an impulse. There’s an upward impulse on the next chart. Wave (ii) of this impulse is sharp, but wave (iv) moves sideways. So, that’s how alternation works in impulses, which have two corrections inside – waves two and four. If alternation occurs, then if one correction has direction, the other one hasn’t got one.
Also, wave (ii) is pretty simple here, but the wave (iv) has more waves inside, so there’s another alternation by complexity.
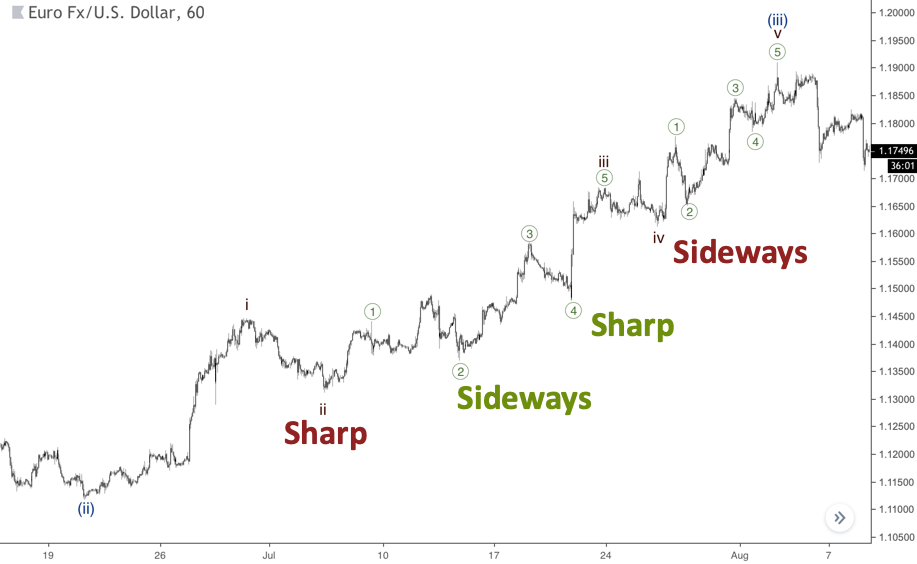
The chart below shows two alternations. Inside wave (iii) we have sharp wave ii, so, as you can guess, wave (iv) is sideways. Another example is in wave iii: its wave two moves sideways and the wave four is sharp, so the order has changed. That’s also a kind of alternation when you face such a successive changing in a shape in waves two and four.
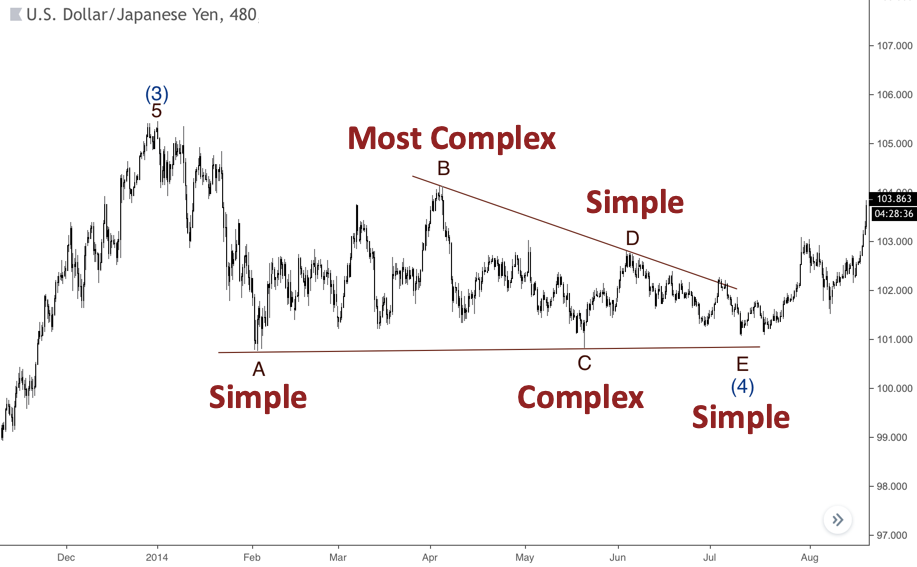
Waves inside corrections subdivide into Simple, Complex and Most Complex. Inside triangles, one of the waves tends to be the most complex. As you can see on the chart below, wave B has the most complex structure while other waves are Simple or Complex.
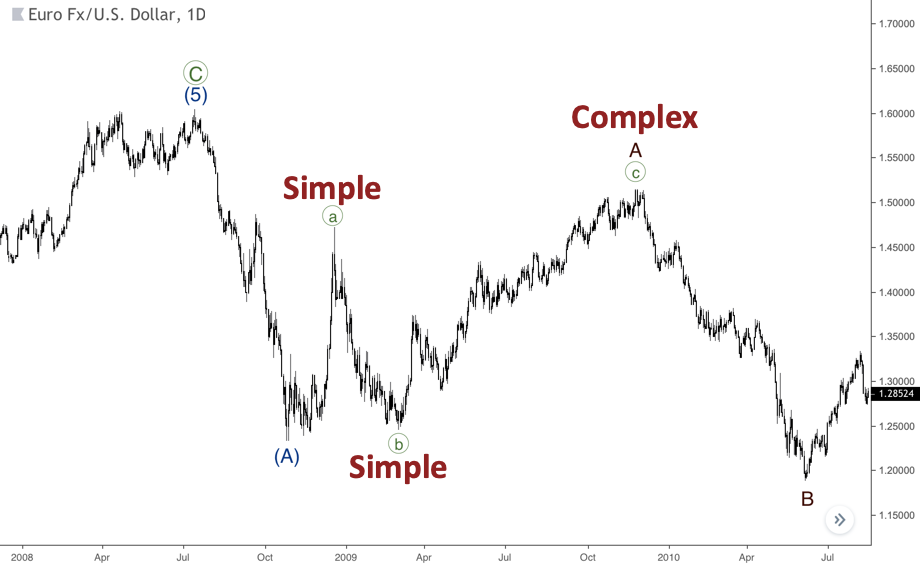
Sometimes one of zigzag’s waves has a more complex structure than others. The next chart represents a case with a complex wave ((c)) in relation to waves ((a)) and ((b)). However, if you are faced with a simple wave A and a complex wave B, then wave C will likely be a simple one as well as wave A.
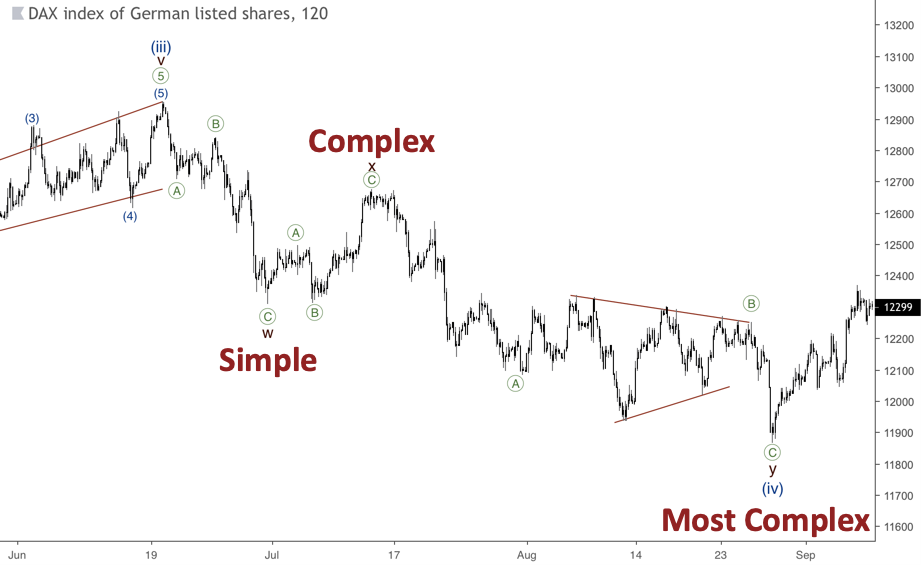
Waves of double zigzag could also express some differences from each other. Let’s have a look at the chart below. The wave (w) is simple, the wave (x) is complex and the wave (y) is the most complex. Thus, if we have quite easy waves W and X of a double zigzag, we shouldn’t rule out the possibility of wave Y complexity.
The consistency ‘Simple-Complex-Most Complex’ could also apply to flats. The next chart shows a case with the most complex wave C. At the same time, wave B could be the most complex, while a massive rally in wave C expresses itself as a simple wave. 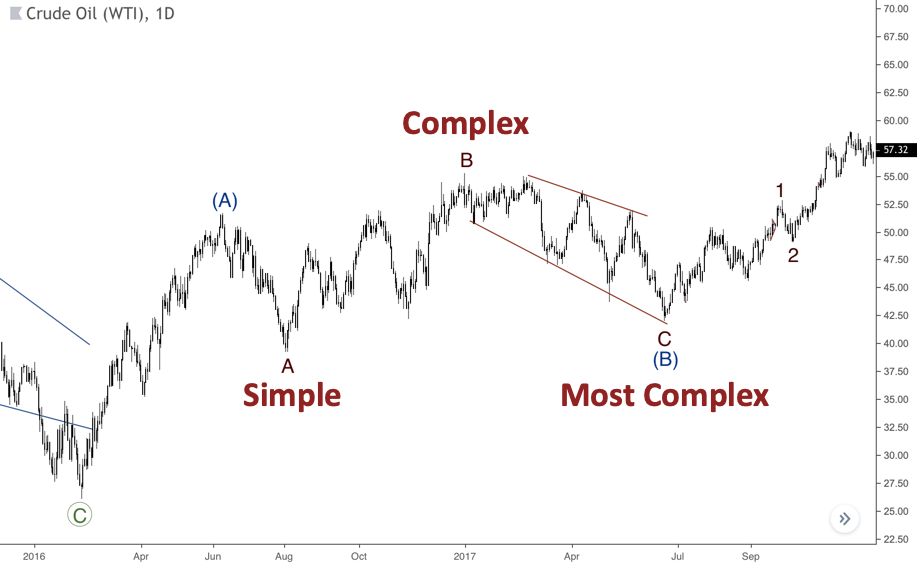
Alternation is one of the most useful guidelines, which helps us understand which style of a wave we could face in the next markets’ stages. It’s not a rule thumb but a very powerful additional tool to improve wave counts.

